Based on students’ interviews about their family photos, create graphs to visualize their “family statistics.”
Get creative. Let the class’s charts be inspired by the statistics they collected about their families. Consider:
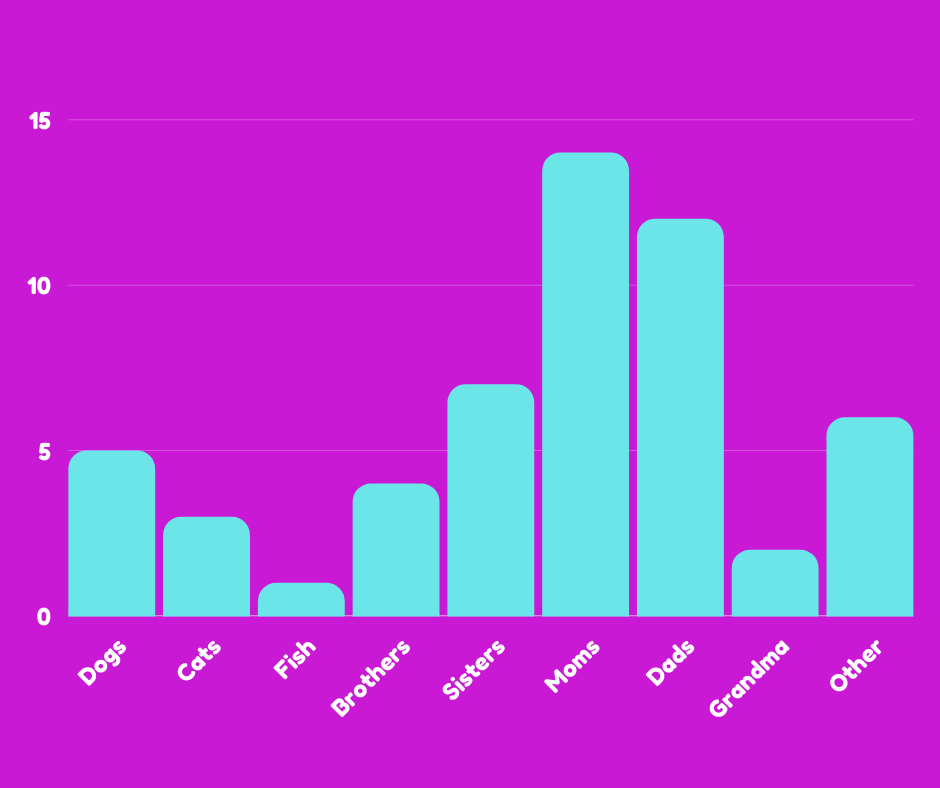
- A pie chart of family pets
- A bar graph of human family members
- A histogram of siblings’ ages
- A graph of hair color, skin color, or eye color of immediate family members